CS3481-Lecture-5
K-means
Cluster analysis
Cluster analysis groups data objects based only on the attributes of the data
The main objective is that
- The objects within a group be similar to one another and
- They are different from the objects in the other groups
Cluster analysis is important in the following areas:
- Biology
- Medicine
- Information retrieval
- Business
Cluster analysis provides an abstraction form individual objects to the clusters in which those data objects reside
Some clustering techniques characterize each cluster in terms of a cluster prototype
The prototype is a data object that is representative of the other objects in the cluster
Differet type of clusterings
We consider the following types of clusterings
- Partitional versus hierarchical
- Exclusive versus fuzzy
- Complete versus partial
Partitional versus hierachical
A partitional clustering is a division of the set of data objects into subsets
A hierachical clustering is a set of nested clusters that are organized as a tree
- Each node (cluster) in the tree (except for the leaf nodes) is the union of its children (sub-clusters).
- The root of the tree is the cluster containing all the objects.
- Often, but not always, the leaves of the tree are singleton clusters of individual data objects.
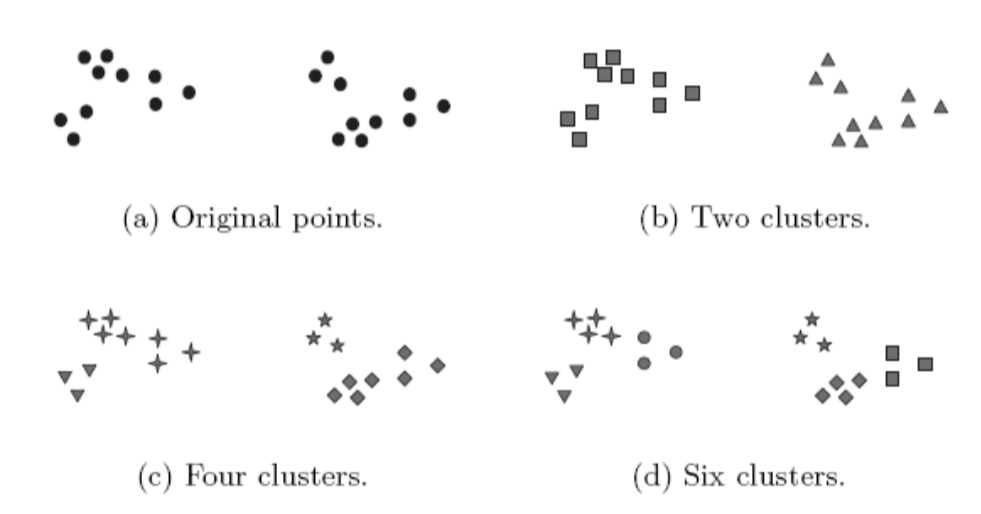
The following figures form a hierachical (nested) clustering with 1, 2, 4 and 6 clusters at each level.
A hierarchical clustering can be viewed as a sequence of partitional clusterings
A partitional clustering can be obtained by taking any member of that sequence, i.e. by cutting the hierarchical tree at a certain level.
Exclusive versus fuzzy
- In an exclusive clustering, each object is assigned to a single cluster
- However, there are many situations in which a point could resonably be placed in more than one cluster
- In a fuzzy clustering, every object belongs to every cluster with a membership wight that is between
- 0 (absolutely does not belong) and
- 1 (absolutely belongs)
- This approach is useful for avoiding the arbitrariness of assigning an object to only one cluster when it is close to serveral.
- A fuzzy clustering can be converted to an exclusive clustering by assigning each object to the cluster in which its membership value is the highest.
Complete versus partial
- A complete clustering assigns every object to a cluster
- A partial clustering does not assign every object to a cluster
- The motivation of partial clustering is that some objects in a data set may not belong to well-defined groups.
- Instead, they may represent noise or outliers
K-means
K-means is a prototype-based clustering techique which creates a one-level partitioning which creates a one-level partitioning of the data objects.
Specifically, K-means ddefines a prototype in terms of the centroid of a group of points
K-means is typically applied to objects in an n-dimensional space.
The basic K-means algorithm is summarized below
- Select K points as initial centroids
- Repeat
a. Form K clusters by assigning each point to its closest centroid.
b. Re-compute the centroid of each cluster - Until centroids do not change
We first choose K initial centroids, where K is a user-defined parameter, namely, the number of clusters desired.
Each point is then assigned to the closest centroid.
Each collection of points assigned to a centroid is a cluster
The centroid of each cluster is then updated based on the points assigned to the cluster
We repeat the assignment and update steps until the centroids remain the same.
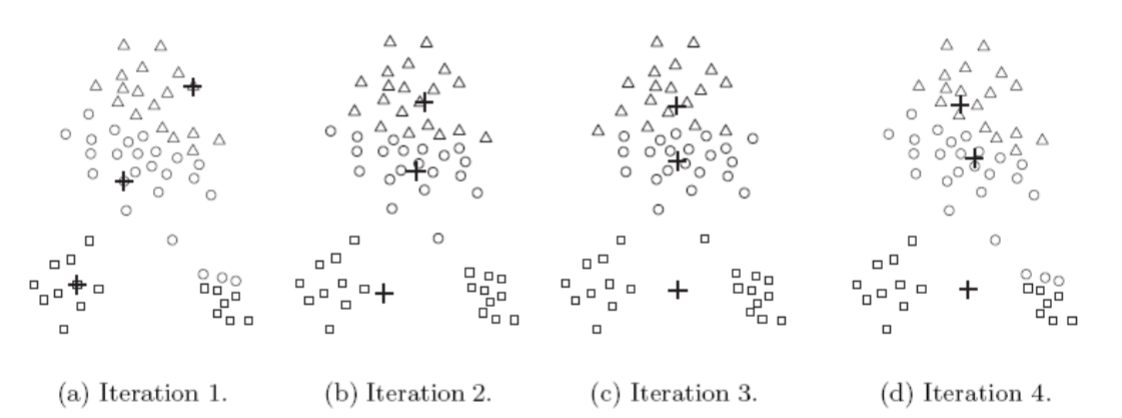
These steps are illustrated in the following figures.
Starting from three centroids, the final clusters are found in four assignment-update steps.

Each sub-figure shows
- The centroids at the start the iteration and
- The assignment of the points to those centroids
The centroids are indicated by the “+” symbol.
All points belonging to the same cluster have the same marker shape.
In the second step
- Points are assigned to the updated centroids and
- The centroids are updated again
We can observe that two of the centroids move to the two small groups of points at the bottom of the figures.
When the K-means algorithm terminates, the centroids hae identified the natural groupings of points
Distance measure
To assign a point to the closest centroid, we need a measure that quantifies the notion of “closest”
Euclidean (L2) distance is often used for this purpose
The goal of clustering is typically expressed by an objective function
We consider the case where Euclidean distance is used
For our objective function, which measures the quality of a clustering solution, we can use the sum of the squared error (SSE)
We calculate the Euclidean distance of each data point to its associated centroid
We then compute the total sum of the squared distances, which is also known as the sum of the squared error(SSE)
A small value of SSE means that the prototpyes(centroids) of this clustering are good representations of the points in their clusters.
The SSE is defined as follows:
In this equation
- x is a data object
- Ci is the i-th cluster
- ci is the centroid of cluster Ci
- d is the Euclidean (L2) distance between two objects
It can be shown that the mean of the data points in the cluster minimizes the SSE of the cluster
The centroid (mean) of the i-th cluster is defined as

In this equation, mi is the number of objects in the i-th cluster
Step 2a adn 2b of the K-means algorithm attempt to minimize the SSE
Step 2a forms clusters by assigning each point to its nearest centroid, which minimizes the SSE for the given set of centroids
Step 2b recomputes the centroids so as to further minimize the SSE

Choosing initial centroids
Choosing the proper initial centroids is the key step of the basic K-means procedure
A common approach is to choose the initial centroids randomly
However, randomly selected initial centroids may be poor choices
This is illustrated in the following figures
One technique that is commonly used to address the problem of choosing initial centroids is to perform multiple runs
Each run uses a different set of initial centroids
We then choose the set of clusters with the minimum SSE
Outliers
Outliers can influence the clusters that are found
When outliers are present, the resulting cluster centroids may not be as representative as they otherwise would be
Because of this, it is often useful to discover outliers and eliminate them beforehand.
To identify the outlers, we can keep track of the contribution of each point to the SSE
We then eliminate those points with unusaully high contributions to the SSE
Post-processing
Two post-porcessing straegies that decrease the SSE by increasing the number of clusters are
- Split a cluster
- The cluster which, when split into two sub-clusters, results in the largest decrease in SSE after updating the centroids is chosen
- Introduce a new cluster centroid
- Often the point that is farthest from its associated cluster centroid is chosen
- We can determine this if we keep track of the contribution of each point to the SSE
- Split a cluster
Two post-processing strategies that decrease the number of clusters, while trying to minimize the increase in SSE, are
- Disprerse a cluster
- This is accomplished by removing the centroid that coreespoinds to the cluster
- The points in that cluster are then re-assigned to other clusters.
- The cluster that is dispersed should be the one that increases the SSE the least after updating the centroids
- Merge two clusters
- We can merge the two clusters that result in the smallest increase in SSE after updating the centroids
- Disprerse a cluster
Limitations of K-means
K-means has a number of limitaions
In particular, the algorithm has difficulty in detecting clusters with non-spherical shapes or widely different sizes or densities
This is because K-means is designed to look for globular clusters of similar sizes and densities, or clusters that are well separated
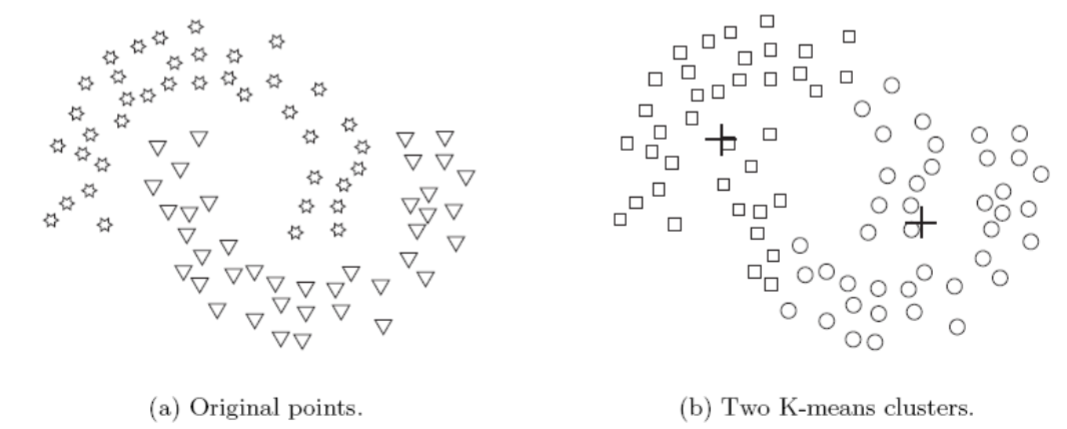
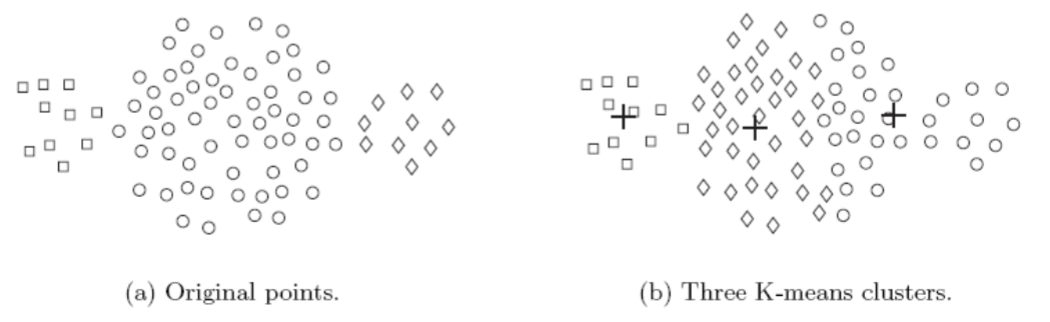
This is illustrated by the following examples
In this example, K-means cannot find the three natural clusters because one of the clsuters is much larger than the other two.
As a result, the largest cluster is divided into sub-clusters
At the same time, one of the smaller clusters is combined with a portion of the largest cluster
In this example, K-means fails to find the three natrual clsuters.
This is because the two smaller clusters are much denser than the largest cluster

In this example, K-means finds two clusters that mix portions of the two natural clsuters
This is because the natural clusters are not globular in shape